

As the core component of “regenerative fillers” (collagen-stimulating fillers), the clinical value of PCL microspheres depends not only on “stimulating collagen” but also on the “dynamic equilibrium during the degradation process”. A recent 30-month long-term study published in the Journal of Biomaterials Applications first revealed the “dual-homeostasis” formula of PCL microsphere degradation through a rabbit subcutaneous implantation model: 12 months of safety + 30 months of efficacy.
Quick Glance at Key Points: The Four-Stage In Vivo Degradation of PCL Microspheres
· 6 months (Risk Peak Period): Accelerated hydrolysis, tissue reaction reaches its peak, and erosion begins on the microsphere surface;
· 12 months (Safety Homeostasis Period): The cellular capsule significantly thins, immune tolerance is established, and safety homeostasis is achieved;
· 18 months (Remodeling Turning Point): Dominated by Type III collagen, forming a remodeled structure with a “rigid outer layer and flexible inner layer”;
· 30 months (Functional Equilibrium Period): Type I and Type III collagen intertwine, achieving a seamless transition from exogenous support to endogenous tissue.
Study Design Description: The study selected two PCL microsphere fillers for direct comparison. The T1 group is an injectable PCL microsphere filler with a broad particle size distribution + containing a gel carrier, with a weight-average molecular weight distributed between 11,000-33,000 Da; the T2 group is a PCL microsphere filler with a relatively uniform particle size and no gel carrier. Both use PCL microspheres as the core component, but there are differences in formulation details such as particle size distribution and carrier components. All subsequent comparisons between the “T1 group” and “T2 group” are based on the in vivo degradation data of these two products.
01. The “Dual-Homeostasis” of In Vivo Degradation of PCL Microspheres
PCL, as a semi-crystalline aliphatic polyester, its in vivo degradation process is dominated by hydrolysis reactions and is synergistically regulated by local enzymatic metabolism and immune cell activities.
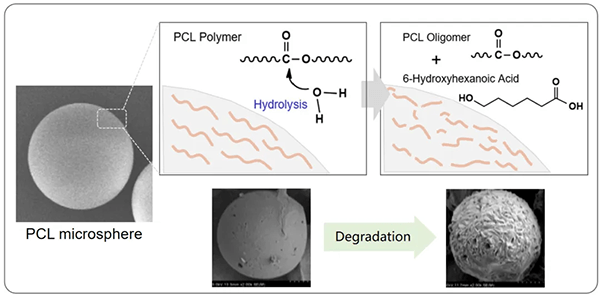 Figure 1. Hydrolysis mechanism of PCL
The clinical value of PCL microsphere fillers depends on their ability to establish and maintain a dynamic equilibrium during the degradation process—that is, the homeostasis between material loss and tissue regeneration. Through a continuous 30-month in vivo animal degradation experiment, this study first proposed the “dual-homeostasis” framework for PCL microsphere fillers.
Table 1. The “Dual-Homeostasis” of PCL Microsphere Fillers
|
Homeostasis Dimension |
Core Connotation |
Establishment Time |
|
Safety Homeostasis |
Controllability of inflammatory response at the material-tissue interface |
About 12 months |
|
Efficacy Homeostasis |
Durability of the structure and function of the filling construct |
Throughout the entire 30 months |
Safety homeostasis and efficacy homeostasis are established synergistically in chronological order, jointly constituting the foundation of the homeostasis between PCL filler degradation and tissue regeneration.
02. Safety Homeostasis of PCL Microspheres—6-Month Risk Peak, 12-Month Immune Tolerance within the “Dual-Homeostasis” of Degradation
The establishment of safety homeostasis takes the “risk peak” as the core node. According to the research results, Table 2 summarizes the changes in various indicators at two key time points: 1 month and 6 months after implantation. In the early stage of implantation, at 0-1 month, hydrolysis has just started, the microsphere morphology remains intact with only slight surface depressions, and the tissue reaction manifests as local acute inflammation; while at 6 months, degradation accelerates, the risk peak officially appears, surface erosion of the microspheres intensifies, the inflammation score rises, and the cellular capsule thickens to its maximum. The differences between the two groups also begin to emerge at this stage: the tissue reaction peak in the T1 group (broader particle size distribution) appears earlier and the inflammation subsides faster; the macrophage score in the T2 group (more uniform particle size) remains high continuously, and the immune recruitment is more long-lasting. The core mechanism for the emergence of the risk peak lies in the regulation of the local degradation product concentration and release kinetics by the microsphere surface erosion rate, which in turn determines the intensity and duration of the inflammatory response.
Table 2. Risk Peak Period
|
Time |
1 month |
6 months |
|
Stage |
Hydrolysis Initiation Period |
Risk Peak Period |
|
Microsphere Morphology Changes |
Intact spherical shape, only slight surface depressions |
Smooth surface layer falls off, striations and pores appear |
|
Tissue Reaction Score |
Relatively low |
Slowly rising |
|
Macrophage Score |
Relatively low |
Rising (M1-dominated inflammation) |
|
Lymphocyte Score |
Relatively low |
Rising |
|
Cell Layer Thickness |
3-110 μm |
T1: 10-530 μm; |
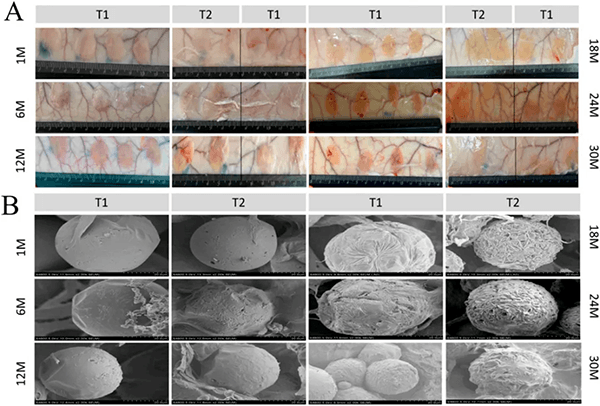
Figure 2. (A) Gross anatomical images; (B) Observation results of PCL microsphere morphology and surrounding fibrous tissues under scanning electron microscope
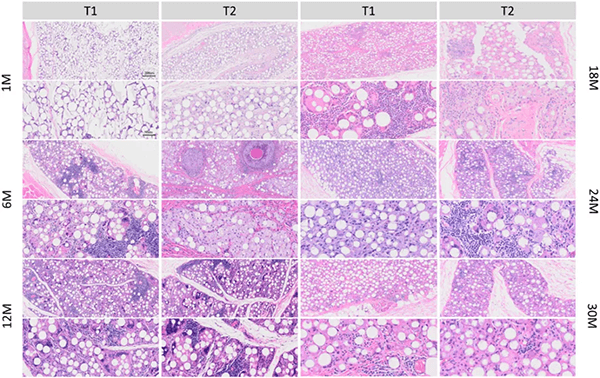
Figure 3. Hematoxylin and Eosin (H&E) staining images
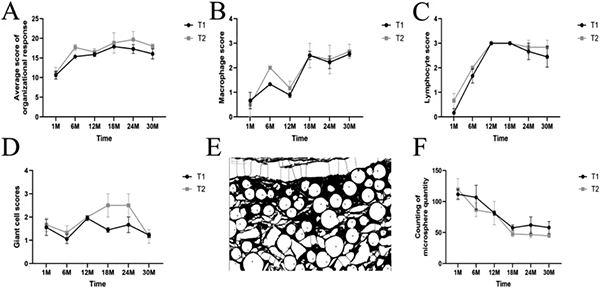
Figure 4. (A) Histological scores based on H&E staining; (B) Macrophage scores; (C) Lymphocyte scores; (D) Giant cell scores; (E) Quantitative analysis of the number of microspheres; (F) Number of microspheres at each time point
After the 6-month risk peak passes, the tissue reaction enters an alleviation stage. Table 3 and Table 4 show the maintenance process of safety homeostasis from 12 months to 30 months. At 12 months, the thickness of the cell layer is significantly reduced compared to 6 months and tends to be stable, marking the official establishment of safety homeostasis. During the period of 18 to 30 months, the tissue reaction score is basically stable and gradually begins to decline, with no foreign body giant cell aggregation or granuloma formation, indicating that the body has established long-term immune tolerance to PCL degradation products. The tissue reaction of the T1 group reached its peak at 18 months, while the T2 group was delayed until after 24 months to reach its peak, but ultimately both groups reached the same level of safety homeostasis at 30 months.
Table 3. Early Stage of Safety Homeostasis
|
Time |
12 months |
18 months |
|
Stage |
Establishment of safety homeostasis |
Maintenance of immune tolerance |
|
Microsphere Morphology Changes |
Striations completely cover the surface and begin to peel off |
Striations peel off, “block-like” and “crystal” structures are widely formed |
|
Tissue Reaction Score |
Tending to stabilize |
Stable |
|
Macrophage Score |
Rising (M2-dominated repair) |
Stable |
|
Lymphocyte Score |
Rising |
Stable |
|
Cell Layer Thickness |
4-90 μm |
T1: 7-150 μm |
Table 4. Late Stage of Safety Homeostasis
|
Time |
24 months |
30 months |
|
Stage |
Maintenance of immune tolerance |
Maintenance of immune tolerance |
|
Microsphere Morphology Changes |
Incomplete thin fibrous layer deposition |
Completely covered by a thin fibrous layer |
|
Tissue Reaction Score |
Stable |
Slightly decreased |
|
Macrophage Score |
Stable |
Stable |
|
Lymphocyte Score |
Stable |
Slightly decreased |
|
Cell Layer Thickness |
T1: 7-130 μm |
T1: 5-120 μm |
03. Efficacy Homeostasis of PCL — Type I Collagen → Type III Collagen → Equilibrium in the In Vivo Degradation’s “Dual-Homeostasis”
The core of establishing efficacy homeostasis is the dynamic matching between material degradation and tissue regeneration, with the goal of seamlessly transitioning from exogenous material support to endogenous tissue support. Through quantitative analysis of collagen staining, this study revealed the complete time sequence of collagen remodeling induced by PCL microspheres. Table 5 summarizes the changes in key indicators during the collagen accumulation period in the process of establishing efficacy homeostasis.
In the early stage of implantation, the filling effect of the material almost entirely relies on the physical occupation of the filler, and collagen is only distributed at the edges.
At 6 months, the filling effect enters a transition period. A large amount of collagen fibers grows into the microsphere area, reaching a peak in area. At this time, the volume growth of newly formed collagen exceeds the volume loss from material degradation, and Type I collagen reaches its peak, providing early mechanical strength.
Table 5. Collagen Accumulation Period
|
Time |
1 month |
6 months |
|
Stage |
Physical Occupation Period |
Transition Period (Regeneration > Degradation) |
|
Total Collagen |
Small amount, distributed only at the material edges |
Large amount of ingrowth, reaching a peak |
|
Type I Collagen |
Small amount, being the dominant type |
Significantly increases, reaching a peak—providing early mechanical strength |
|
Type III Collagen |
Extremely little |
Slightly increased |
|
Main Features |
Relies on the physical occupation of the filler |
Material + newly formed collagen forms a composite support structure |
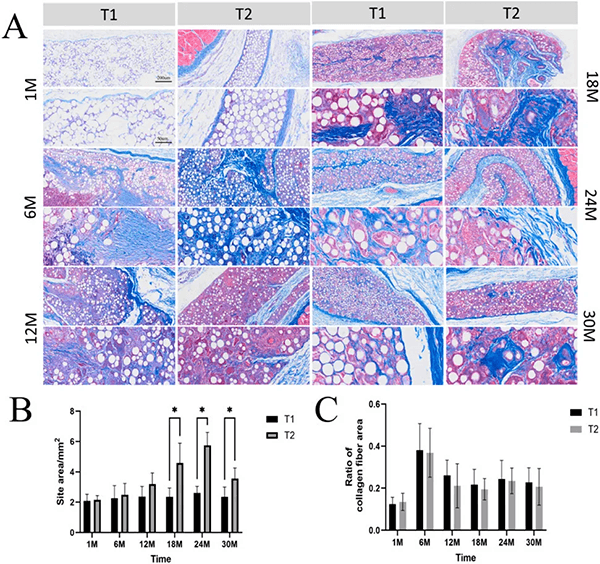
Figure 5. (A) Masson’s trichrome staining results, showing the growth trend of collagen fibers; (B) Implantation site area; (C) Area ratio of collagen fibers
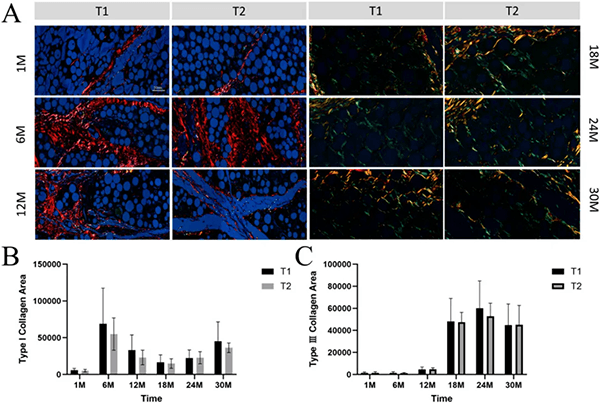
Figure 6. (A) Growth trends of Type I and Type III collagen fibers; (B) Statistical analysis of Type I collagen areas; (C) Statistical analysis of Type III collagen areas
After 6 months, collagen remodeling enters a more refined structural adjustment stage. Table 6 shows the changes in key indicators during the remodeling equilibrium period. At 12 months, the total amount of collagen significantly decreases compared to 6 months, but this is not a fading of the filling effect, but the beginning of structural remodeling; at this time, the collagen type is undergoing a conversion.
18 months is a key turning point for the structural remodeling of the filling body. At this time, Type III collagen gradually replaces Type I collagen, becoming the main component of the filling area, promoting vascular ingrowth and cell migration; while Type I collagen is concentrated in the peripheral wrapping layer to maintain morphological stability, forming a composite structure with a “rigid outer layer and flexible inner layer”.
At 30 months, the area of Type I collagen increases again, intertwining with Type III collagen. The filling body evolves into a composite structure dominated by its own collagen network, achieving a seamless transition from exogenous material to endogenous tissue.
Table 6. Remodeling Equilibrium Period
|
Time |
12 months |
18 months |
24 months |
30 months |
|
Stage |
Remodeling Initiation Period |
Remodeling Turning Point |
Homeostasis Transition Period |
Homeostasis Mature Period |
|
Total Collagen |
Significantly decreased compared to the peak |
Tends to be stable |
Stable |
Stable, forming a reticular wrap |
|
Type I Collagen |
Still the dominant type |
Concentrated in the outer layer, providing a mechanical barrier |
Slowly increasing |
Increasing, intertwined with Type III |
|
Type III Collagen |
Small amount |
Dominant, promoting vascular ingrowth and cell migration |
Maintains dominance |
Intertwined with Type I |
|
Main Features |
Total collagen decreases, types begin to convert |
Type III dominates, rigid outer layer / flexible inner layer |
Degradation product deposition, stable interfacial layer formation |
Seamless transition from exogenous filler to endogenous filler |
04. Two Formulations—Different Paths, Same Destination
The study compared two different formulations of PCL microsphere fillers. Although they present different patterns in degradation kinetics and tissue responses, both achieved a thin fibrous layer covering the microsphere surface at 30 months, with degradation products deposited to form a stable interfacial layer, and Type I and Type III collagen intertwined. Both safety homeostasis and efficacy homeostasis were established and maintained. Such results indicate that the formulation design of PCL microsphere fillers is flexible, and different strategies can achieve safety homeostasis and efficacy homeostasis, providing a scientific basis for personalized clinical selection.
Table 7. Correlation between Physicochemical Properties and In Vivo Responses of PCL Microspheres
|
Physicochemical Properties |
T1 |
T2 |
In Vivo Responses |
|
Particle Size Distribution |
30 μm ≤ D50 ≤ 45 μm |
Relatively uniform, D50 ≈ 37 μm |
T1 risk peak appears earlier; T2 immune response is delayed, but lasts longer |
|
Gel Carrier |
Present |
Absent |
T1 initial implantation area is smaller; |
|
Surface Morphology |
Smooth → striated erosion → porous structure → block/crystalline |
Smooth → striated erosion → porous structure → block/crystalline |
Synchronous for both |
|
Type I Collagen Peak |
6M (Early mechanical support) |
6M (Early mechanical support) |
Synchronous for both |
|
Type III Collagen Peak |
24M (Tissue remodeling) |
24M (Tissue remodeling) |
Basically synchronous for both |
|
Establishment of Safety Homeostasis |
12M |
12M |
Kinetics differ, but the time course converges |
|
Maintenance of Efficacy Homeostasis |
Throughout 30M |
Throughout 30M |
Synchronous for both |
05. Confirmation from In Vitro Evidence—Looking at Degradation from a Molecular Perspective
The above study answers “how PCL microspheres degrade in vivo” from the tissue level, while in vitro degradation data provides another perspective from the physicochemical parameters of the material itself. The following is the data on mass residual rate, weight-average molecular weight, and intrinsic viscosity changes of PCL microspheres obtained based on in vitro simulated degradation experiments.
The data shows that within 27 weeks, the mass residual rate of PCL microspheres is basically maintained at 100%, and no obvious macroscopic mass loss has occurred yet; however, the intrinsic viscosity shows a smooth downward trend, indicating that the hydrolytic cleavage of the polymer chains has started. The slight increase in weight-average molecular weight at 5 weeks may be related to the elution of oligomers.
The three types of indicators jointly reveal that the degradation of PCL follows the sequence of “chain scission first, weight loss later”. This finding is highly consistent with the “surface erosion-dominated” degradation mechanism in the literature, and also provides a molecular-level explanation for understanding the in vivo performance of PCL microsphere fillers showing “initial morphological integrity and gradual disintegration in the later stage”.
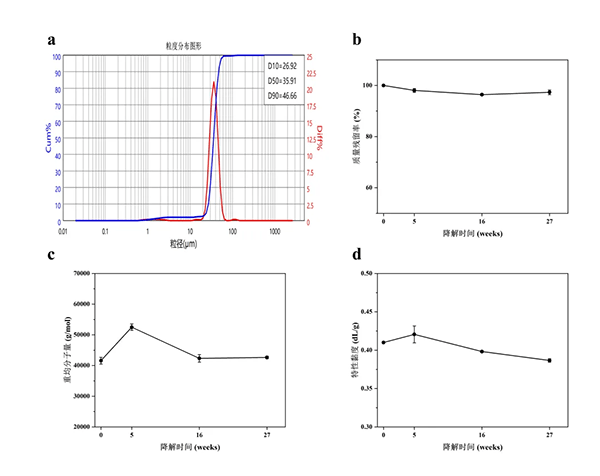
Figure 7. (a) Original particle size distribution of PCL microspheres; During in vitro degradation of PCL microspheres: (b) Mass residual rate; (c) Weight-average molecular weight; (d) Changes in intrinsic viscosity over time
Proton nuclear magnetic resonance (1H-NMR) spectrum testing from another in vitro degradation study on porous PCL microspheres showed that the degradation peak area of PCL microspheres was relatively stable before 52 weeks, and began to increase significantly at 78 weeks (about 18 months). This turning point of molecular chain scission is highly consistent with the time point of microsphere structure dissociation and the initiation of Type III collagen remodeling observed at 18 months in this in vivo study.
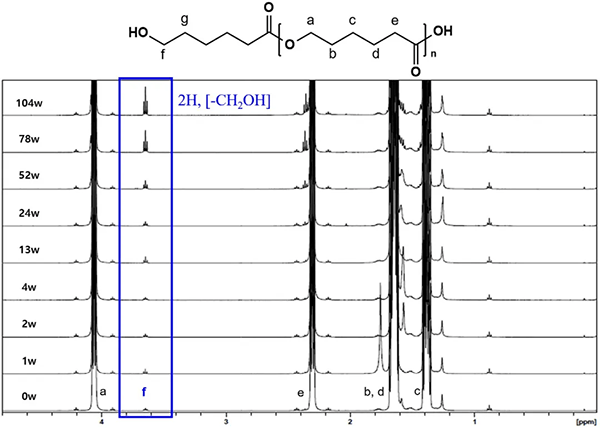
Figure 8. 1H-NMR spectra obtained after in vitro incubation of PCL microspheres in PBS solution at 37°C for a certain period of time
This 30-month in vivo study first elucidated the dual-homeostasis mechanism of PCL microsphere fillers, proving that PCL microsphere fillers in vivo follow the degradation law of “6-month risk peak → 12-month safety homeostasis → 18-month collagen remodeling → 30-month functional equilibrium”. In vitro data further confirms that PCL degradation follows the molecular logic of “chain scission first, weight loss later”. In vivo and in vitro evidence jointly indicate that the degradation behavior of PCL microsphere fillers is designable, predictable, and evaluable.
eSUNMed has established a complete product matrix covering medical-grade PCL polymer raw materials and PCL microspheres, and provides full-process customized services such as intrinsic viscosity customization, microsphere particle size regulation, and surface morphology design. The table below lists the main product grades and their intrinsic viscosity parameters, which can be flexibly adjusted according to customer needs to adapt to different degradation cycles and application scenarios.
Table 8. eSUNMed PCL Series Product Matrix
|
Product Name |
Grade |
Intrinsic Viscosity (dL/g) |
Testing Conditions |
|
PCL Polymer |
PCL02 |
0.20-0.26 |
THF, 25°C |
|
PCL04 |
0.35-0.43 |
THF, 25°C |
|
|
PCL08 |
0.70-0.90 |
THF, 25°C |
|
|
PCL12 |
1.00-1.30 |
THF, 25°C |
|
|
PCL17 |
1.50-1.90 |
THF, 25°C |
|
|
PCL Microspheres |
MP-PCL02A |
0.20-0.26 |
THF, 25°C |
|
MP-PCL04A |
0.35-0.43 |
THF, 25°C |
|
|
MP-PCL08A |
0.70-0.90 |
THF, 25°C |
|
|
MP-PCL12A |
1.00-1.30 |
THF, 25°C |
|
|
mPEG-PCL Polymer |
/ |
0.8-1.2 |
THF, 25°C |
|
mPEG-PCL Microspheres |
/ |
0.8-1.2 |
THF, 25°C |
References:
[1] Wu S, Guo Q, Liu R, Yan Z, Tang R, Pang S, Chen W, Yuan T. Study on the homeostasis mechanism of in vivo degradation of PCL microsphere fillers. J Biomater Appl. 2026 Jul 8:8853282261469759.
[2] Kim, J.-S., Sung, J.-H., Kwon, D.-Y., Park, J.-E., Cho, H. and Yoon, H.-S. (2025), Biodegradability and Efficacy of Porous Polycaprolactone Microsphere Dermal Filler for Fine Lines. J Cosmet Dermatol, 24: e70156.